
Measuring LNB Output VSWR
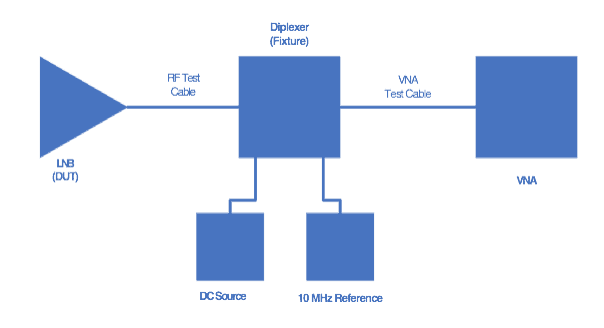
Measuring the output VSWR of a conventional LNB is a challenge in the lab and in the field because most LNBs require DC and sometimes 10 MHz reference signals to be multiplexed on the RF output.
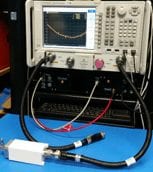
If you use a conventional vector network analyzer you will need to use a BiasT, Diplexer or a Mux-Tee to insert DC onto the cable to power the LNB.
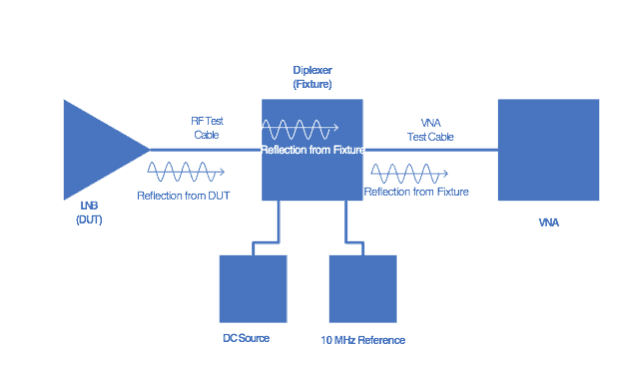
The problem is that you will be measuring the VSWR at the output of the BiasT and not the VSWR at the LNB output. If the BiasT is a perfect 50 Ohms then it may not affect the results much. However, inexpensive BiasT’s can have VSWRs up to 1.8:1 which could dominate the response – in effect you’re mostly measuring the VSWR of the BiasT.
Another issue that can cause VNA’s to give erroneous results is due to the 10 MHz reference signal. If some of the power from the 10 MHz reference signal is received by the VNA – it may not filter out these signals and may thus may not be accurate. This is likely more of a problem with Scalar Network Analyzers, but VNAs can also be susceptible.
There are 3 good solutions to this problem:
1. Use a VNA with a built-in BiasT – such as the Keysight PNA series of VNAs
In these instruments the BiasT is installed behind the measuring receivers and therefore does not impact the signals that are sent or received between the VNA and the LNB. The VNA is simply calibrated normally for the frequency band you are interested in measuring (usually L-Band), plug into the LNB and then apply power to the Bias Input (be careful not to try to use your calkit while the DC Bias is applied. We always keep spare fuses for the Bias In on-hand).
2. The second option is to “de-embed” the BiasT or Diplexer.
Some VNAs can either automatically de-embed fixtures and connectors for you to remove the effects of items between the VNA calibration plane and the input to the DUT. This is handy when measuring VSWR on waveguide inputs as you can quickly calibrate the reference plane on the coaxial connectors of the end of the VNA cables and then use a waveguide transition that you have measured S-parameter files for. By de-embedding you can program the VNA to remove the effects of the fixture and move the reference plane to the DUT end of the fixture. A BiasT or Diplexer can also be parameterized and de-embedded. This will work well if the frequency response and VSWR of the BiasT is significantly better than the DUT – otherwise you might see “noisy” or somewhat more erratic results. Remember that all adapters and connectors in the chain can have an impact on the VSWR and should be included as part of the fixture.
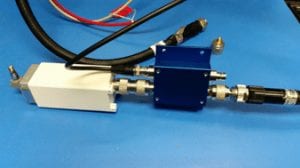
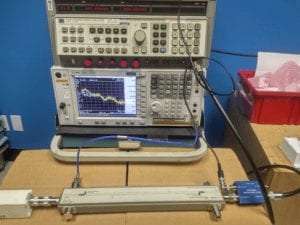
LNB shown with an Orbital Mux-Tee (the fixture)
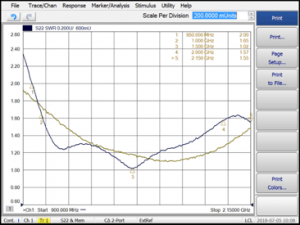
The blue line shows the VSWR without de-embedding, the brown line shows the VSWR with the fixture de-embedded. Notice that the effect of the fixture both increases and decreases the apparent VSWR due to the reflections adding or subtracting at different frequencies.
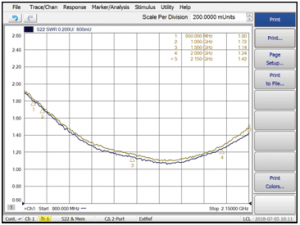
The diagram above shows a comparison of the de-embedded VSWR with a fixture vs. the VSWR with the VNA internal BiasT.
3. The final recommended method is the “old school” approach.
Use a dual directional coupler between the BiasT and the DUT and measure the forward and reverse power. The measurements can be done with spectrum analyzers, power meters or diode detectors as used with scalar network analyzers. The return loss then is simply the forward power minus the reverse power measured.
- With older spectrum analyzers without trace math the easiest way to get a quick, reasonably accurate measurement across the frequency band set up is shown in the diagram below. To calibrate, connect reflected path of the coupler to the spectrum analyzer and terminate the coupler output with a calkit short (ensure that the inserted is turned OFF). Turn on the sweep generator and set the reference level of the spectrum analyzer so that the sweep is on the top reference line. This doesn’t compensate for ripple on the cable or any other variations in the transmission path and assumes that the short on the output reflects 100% of the energy back. This is assumed to be 0 dB return loss and if we put it on the top reference of the screen, return loss of our DUT is the number of dB down from the top reference line with a reasonable scale such as 2 dB/div or 5 dB/div.
Now connect your DUT and read the return loss as dB down from the top reference line.
This will give you about +/- 2.0 dB accuracy if you have a good quality directional coupler.
- If you require better accuracy and have a spectrum analyzer that allows you to download trace data (or capture via GPIB for example) you would:
- With DC off plug the DUT end of the coupler directly into the spectrum analyzer. Measure the through loss of the sweeper to DUT path by setting the spectrum analyzer into max hold mode and save the data.
- Turn the coupler around and insert the sweeper into the DUT port and the spectrum analyzer into the coupled port and terminate the input port with a 50 Ohm load. Set the spectrum analyzer onto max hold and save the coupler loss.
- Set the system up with the DUT on the output port and the coupled reflected coupler port plugged into the spectrum analyzer. Set the analyzer for max hold capture and save the reflected power.
- In Excel you can easily calculate the return loss as:
Reflected Power(dBm) – Coupler Loss(dBm) – Through Loss(dBm)
- For a lower cost test configuration, you can always use power meters with the same dual directional coupler. In this case you set up with one power meter on the reflected port and one power meter on the forward power coupled port. If accuracy is important you can measure the coupling factors of the coupled ports and create a loss variation table for each port. The return loss in this case is:Return Power(dBm) – Forward Power(dBm)
To make the measurements quicker, scripts can be generated in Excel, Python or Matlab to pull the data from the test instruments. Keysight’s Command Expert is an excellent tool to find the commands and check them against a live instrument. It also can generate the code required for many platforms including Python.
See an example Python script to measure VSWR with power meters.
See an example Python script to measure VSWR with a spectrum analyzer.
Orbital Research Mux-Tees (diplexers that allow insertion of 10 MHz and DC while passing through the L-Band LNB output) have typical return losses of greater than 20 dB, which can be more easily de-embedded. Contact us for more information about Orbital’s Mux-Tees.